
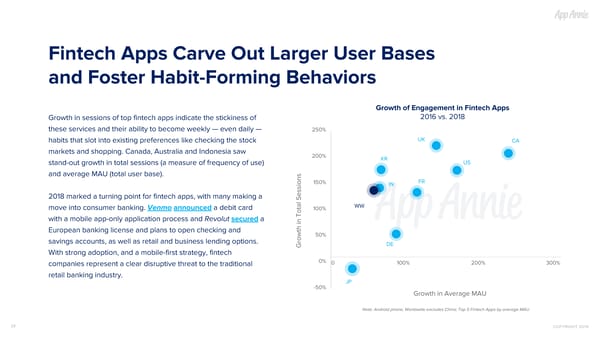
Fintech Apps Carve Out Larger User Bases and Foster Habit-Forming Behaviors Growth of Engagement in Fintech Apps 2016 vs. 2018 Growth in sessions of top fintech apps indicate the stickiness of these services and their ability to become weekly — even daily — 250% UK habits that slot into existing preferences like checking the stock CA markets and shopping. Canada, Australia and Indonesia saw 200% KR US stand-out growth in total sessions (a measure of frequency of use) and average MAU (total user base). FR 150% IN 2018 marked a turning point for fintech apps, with many making a WW move into consumer banking. Venmo announced a debit card 100% with a mobile app-only application process and Revolut secured a European banking license and plans to open checking and 50% savings accounts, as well as retail and business lending options. DE Growth in Total Sessions With strong adoption, and a mobile-first strategy, fintech 0% 0 100% 200% 300% companies represent a clear disruptive threat to the traditional retail banking industry. JP -50% Growth in Average MAU Note: Android phone; Worldwide excludes China; Top 5 Fintech Apps by average MAU 39 COPYRIGHT 2019
 The State of Mobile 2019 Page 38 Page 40