
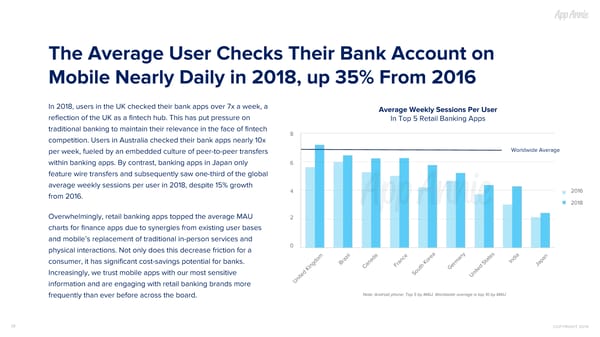
The Average User Checks Their Bank Account on Mobile Nearly Daily in 2018, up 35% From 2016 In 2018, users in the UK checked their bank apps over 7x a week, a Average Weekly Sessions Per User reflection of the UK as a fintech hub. This has put pressure on In Top 5 Retail Banking Apps traditional banking to maintain their relevance in the face of fintech 8 competition. Users in Australia checked their bank apps nearly 10x Worldwide Average per week, fueled by an embedded culture of peer-to-peer transfers within banking apps. By contrast, banking apps in Japan only 6 feature wire transfers and subsequently saw one-third of the global average weekly sessions per user in 2018, despite 15% growth 2016 4 from 2016. 2018 Overwhelmingly, retail banking apps topped the average MAU 2 charts for finance apps due to synergies from existing user bases and mobile’s replacement of traditional in-person services and 0 physical interactions. Not only does this decrease friction for a consumer, it has significant cost-savings potential for banks. India Brazil Japan France Canada Germany Increasingly, we trust mobile apps with our most sensitive South Korea United States United Kingdom information and are engaging with retail banking brands more Note: Android phone; Top 5 by MAU, Worldwide average is top 10 by MAU frequently than ever before across the board. 38 COPYRIGHT 2019
 The State of Mobile 2019 Page 37 Page 39