
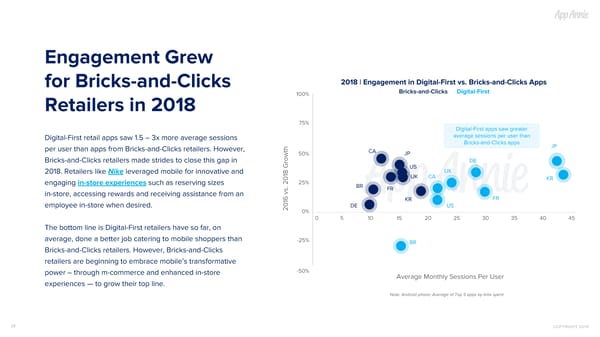
Engagement Grew 2018 | Engagement in Digital-First vs. Bricks-and-Clicks Apps for Bricks-and-Clicks Bricks-and-Clicks Digital-First 100% Retailers in 2018 75% Digital-First apps saw greater average sessions per user than Digital-First retail apps saw 1.5 – 3x more average sessions Bricks-and-Clicks apps JP per user than apps from Bricks-and-Clicks retailers. However, CA JP 50% Bricks-and-Clicks retailers made strides to close this gap in DE US UK 2018. Retailers like Nike leveraged mobile for innovative and UK CA KR 25% engaging in-store experiences such as reserving sizes BR FR in-store, accessing rewards and receiving assistance from an FR KR employee in-store when desired. DE US 2016 vs. 2018 Growth 0% 0 5 10 15 20 25 30 35 40 45 The bottom line is Digital-First retailers have so far, on average, done a better job catering to mobile shoppers than -25% BR Bricks-and-Clicks retailers. However, Bricks-and-Clicks retailers are beginning to embrace mobile’s transformative -50% power – through m-commerce and enhanced in-store Average Monthly Sessions Per User experiences — to grow their top line. Note: Android phone; Average of Top 5 apps by time spent 28 COPYRIGHT 2019
 The State of Mobile 2019 Page 27 Page 29