
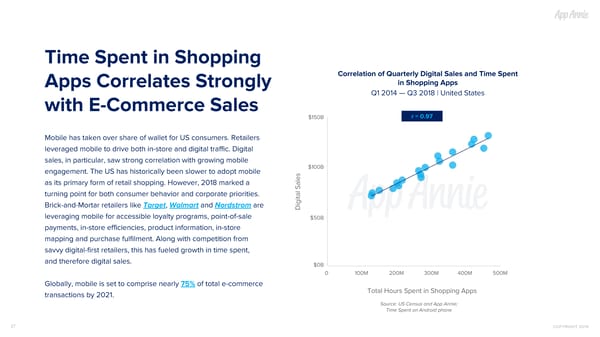
Time Spent in Shopping Correlation of Quarterly Digital Sales and Time Spent in Shopping Apps Apps Correlates Strongly Q1 2014 — Q3 2018 | United States with E-Commerce Sales r = 0.97 $150B Mobile has taken over share of wallet for US consumers. Retailers leveraged mobile to drive both in-store and digital traffic. Digital sales, in particular, saw strong correlation with growing mobile $100B engagement. The US has historically been slower to adopt mobile as its primary form of retail shopping. However, 2018 marked a turning point for both consumer behavior and corporate priorities. Brick-and-Mortar retailers like Target, Walmart and Nordstrom are Digital Sales leveraging mobile for accessible loyalty programs, point-of-sale $50B payments, in-store efficiencies, product information, in-store mapping and purchase fulfilment. Along with competition from savvy digital-first retailers, this has fueled growth in time spent, and therefore digital sales. $0B 0 100M 200M 300M 400M 500M Globally, mobile is set to comprise nearly 75% of total e-commerce Total Hours Spent in Shopping Apps transactions by 2021. Source: US Census and App Annie; Time Spent on Android phone 27 COPYRIGHT 2019
 The State of Mobile 2019 Page 26 Page 28