
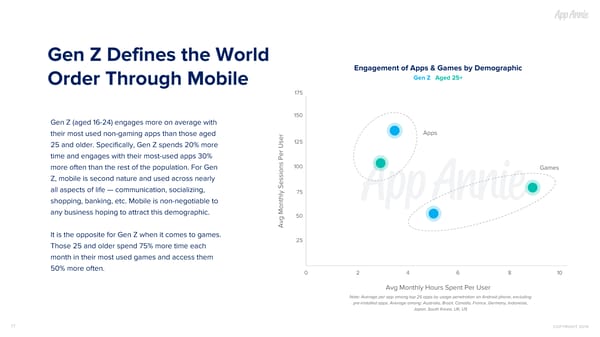
Gen Z Defines the World Engagement of Apps & Games by Demographic Gen Z Aged 25+ Order Through Mobile 175 150 Gen Z (aged 16-24) engages more on average with Apps their most used non-gaming apps than those aged 125 25 and older. Specifically, Gen Z spends 20% more time and engages with their most-used apps 30% 100 more often than the rest of the population. For Gen Games Z, mobile is second nature and used across nearly all aspects of life — communication, socializing, 75 shopping, banking, etc. Mobile is non-negotiable to any business hoping to attract this demographic. 50 Avg Monthly Sessions Per User It is the opposite for Gen Z when it comes to games. 25 Those 25 and older spend 75% more time each month in their most used games and access them 50% more often. 0 2 4 6 8 10 Avg Monthly Hours Spent Per User Note: Average per app among top 25 apps by usage penetration on Android phone, excluding pre-installed apps. Average among: Australia, Brazil, Canada, France, Germany, Indonesia, Japan, South Korea, UK, US 17 COPYRIGHT 2019
 The State of Mobile 2019 Page 16 Page 18